- A 6-10 mile threshold workout
- A long run lasting 90-120 minutes
- A short recovery run
- 3k-5K paced work
- Mile paced strides, 2-3 sets
While most of our testing metrics are subjective, we know we provided fair assessment between the different models, testing them multiple times under many conditions. Most pairs of shoes went through significantly more miles than required.
Cushioning and Landing Comfort
We created our standardized test loop, which features various terrains and gradients, to better compare cushioning and landing comfort. We took each model on a run around the loop and noted what we liked and didn't like about the cushioning. We then took each model on a long run to see how well the cushioning reduced fatigue. Similarly, each shoe was assessed over a shorter recovery run to see how the cushioning felt at slower paces. Taking notes on fatigue, discomfort, and perceived impact helped us narrow down which cushioning we liked the best.
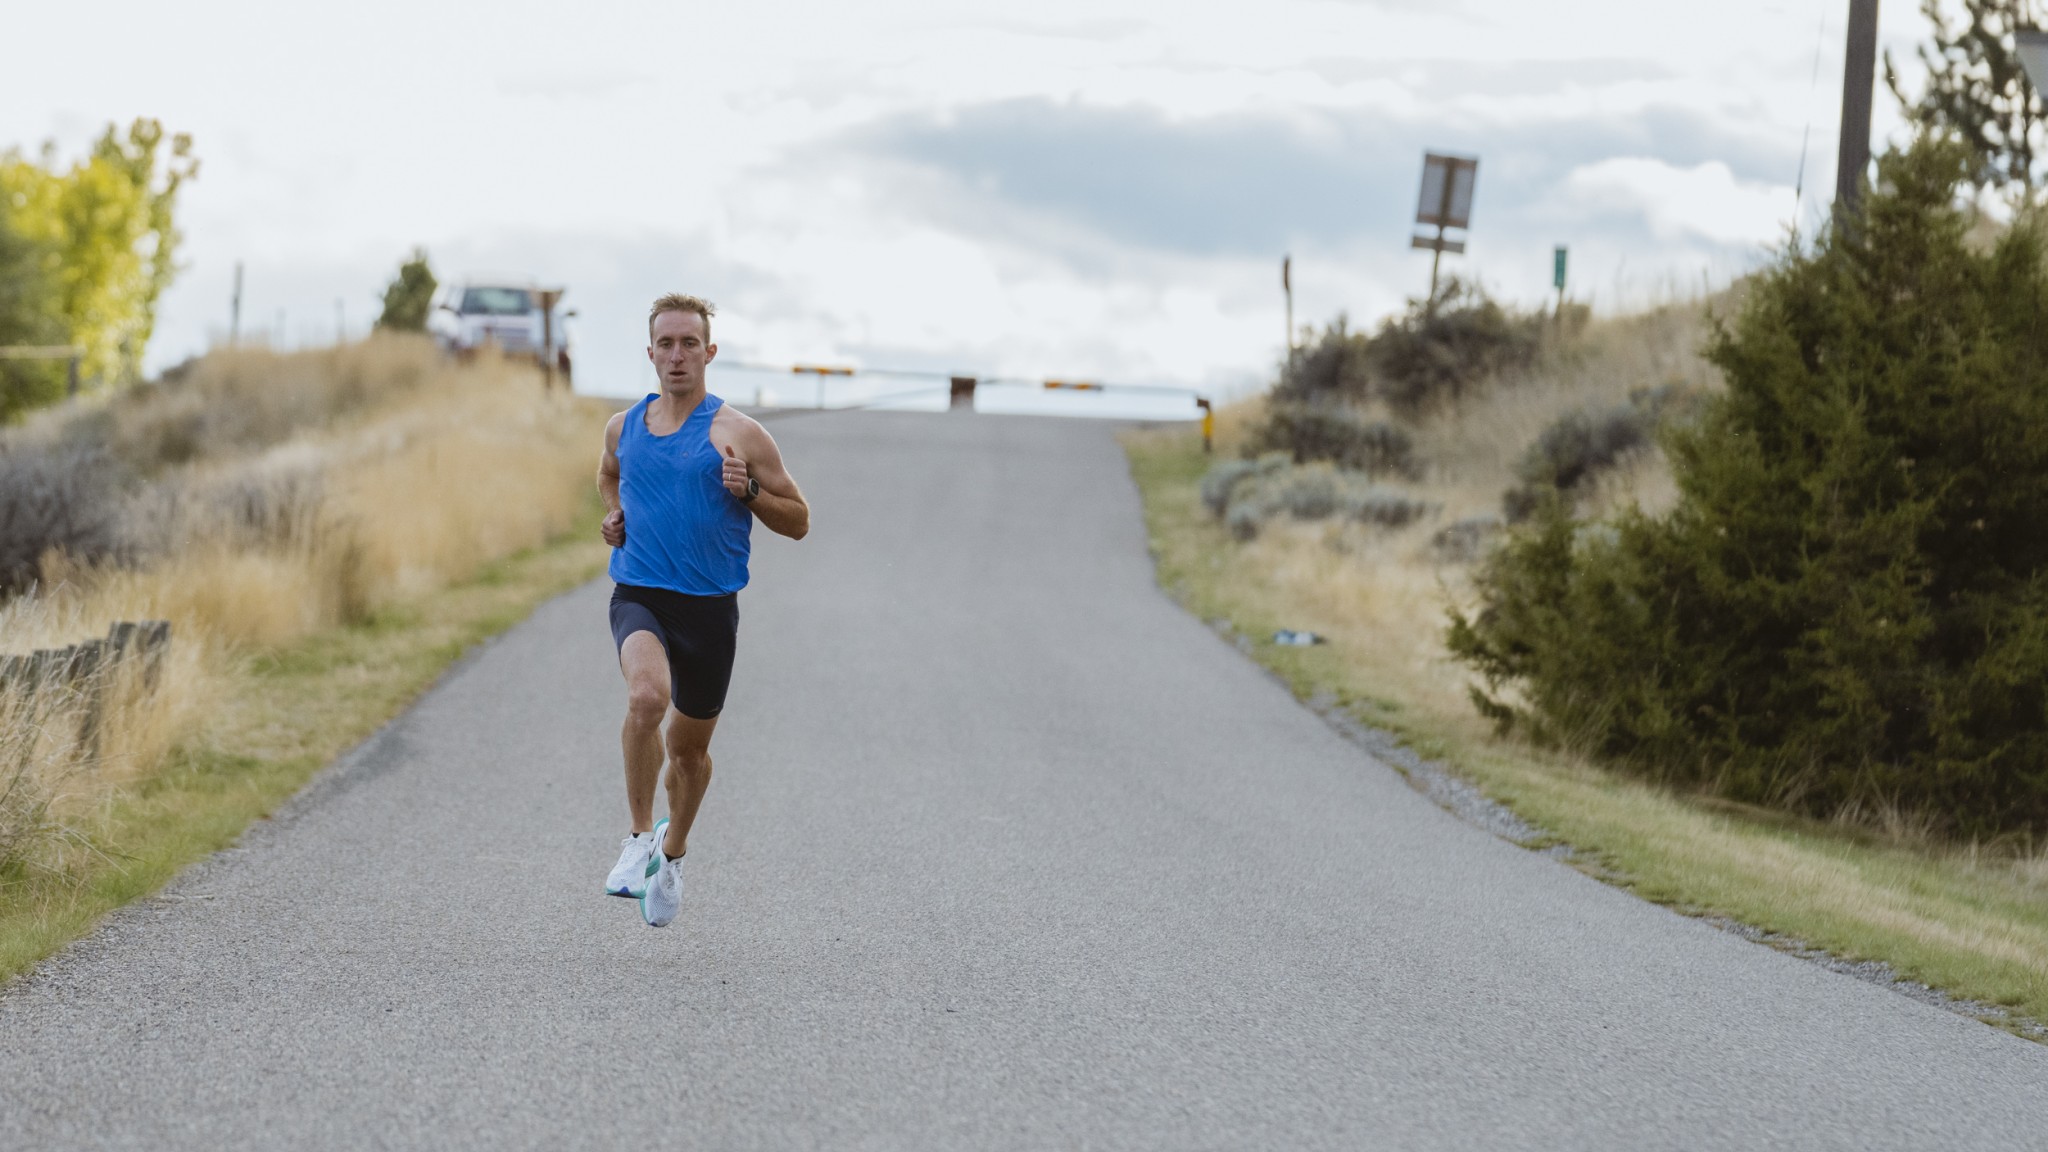
Responsiveness
Our assessment of responsiveness came over the course of a variety of runs. We performed a threshold session of 6-10 miles for each model and noted how we liked the responsiveness. Similarly, we assessed the ability to hit faster paces during sessions at 3k-5k pace, strides at mile pace or faster, and alactic sprints. We considered objective measures of pace as well as subjective measures of feel, and completed side-by-side testing to see which had the fastest feel and produced the most rebound for our energy input.
Lateral Stability and Support
One of the main reasons we wanted to make sure our test loop had different surfaces was to check for lateral stability and support. This allowed us to analyze how the different heel drops and stack heights impacted this performance metric. We took careful note of how the stability transferred into our ankles and knees. We also examined the wideness of the models to see if there was a correlation between width and stability. Models that were more stable and supportive received the highest scores. We also considered models that were designed to be stability shoes, and whether their approach was effective.
Upper Comfort
Upper comfort was evaluated by comparing all of the run types and noting which upper worked best with our foot. We tried differing thicknesses of socks and ran in different weather conditions. We analyzed the toe box and heel cup, looked at the different footbeds and arch support types, and checked for hot spots or blisters and pressure points from the upper.
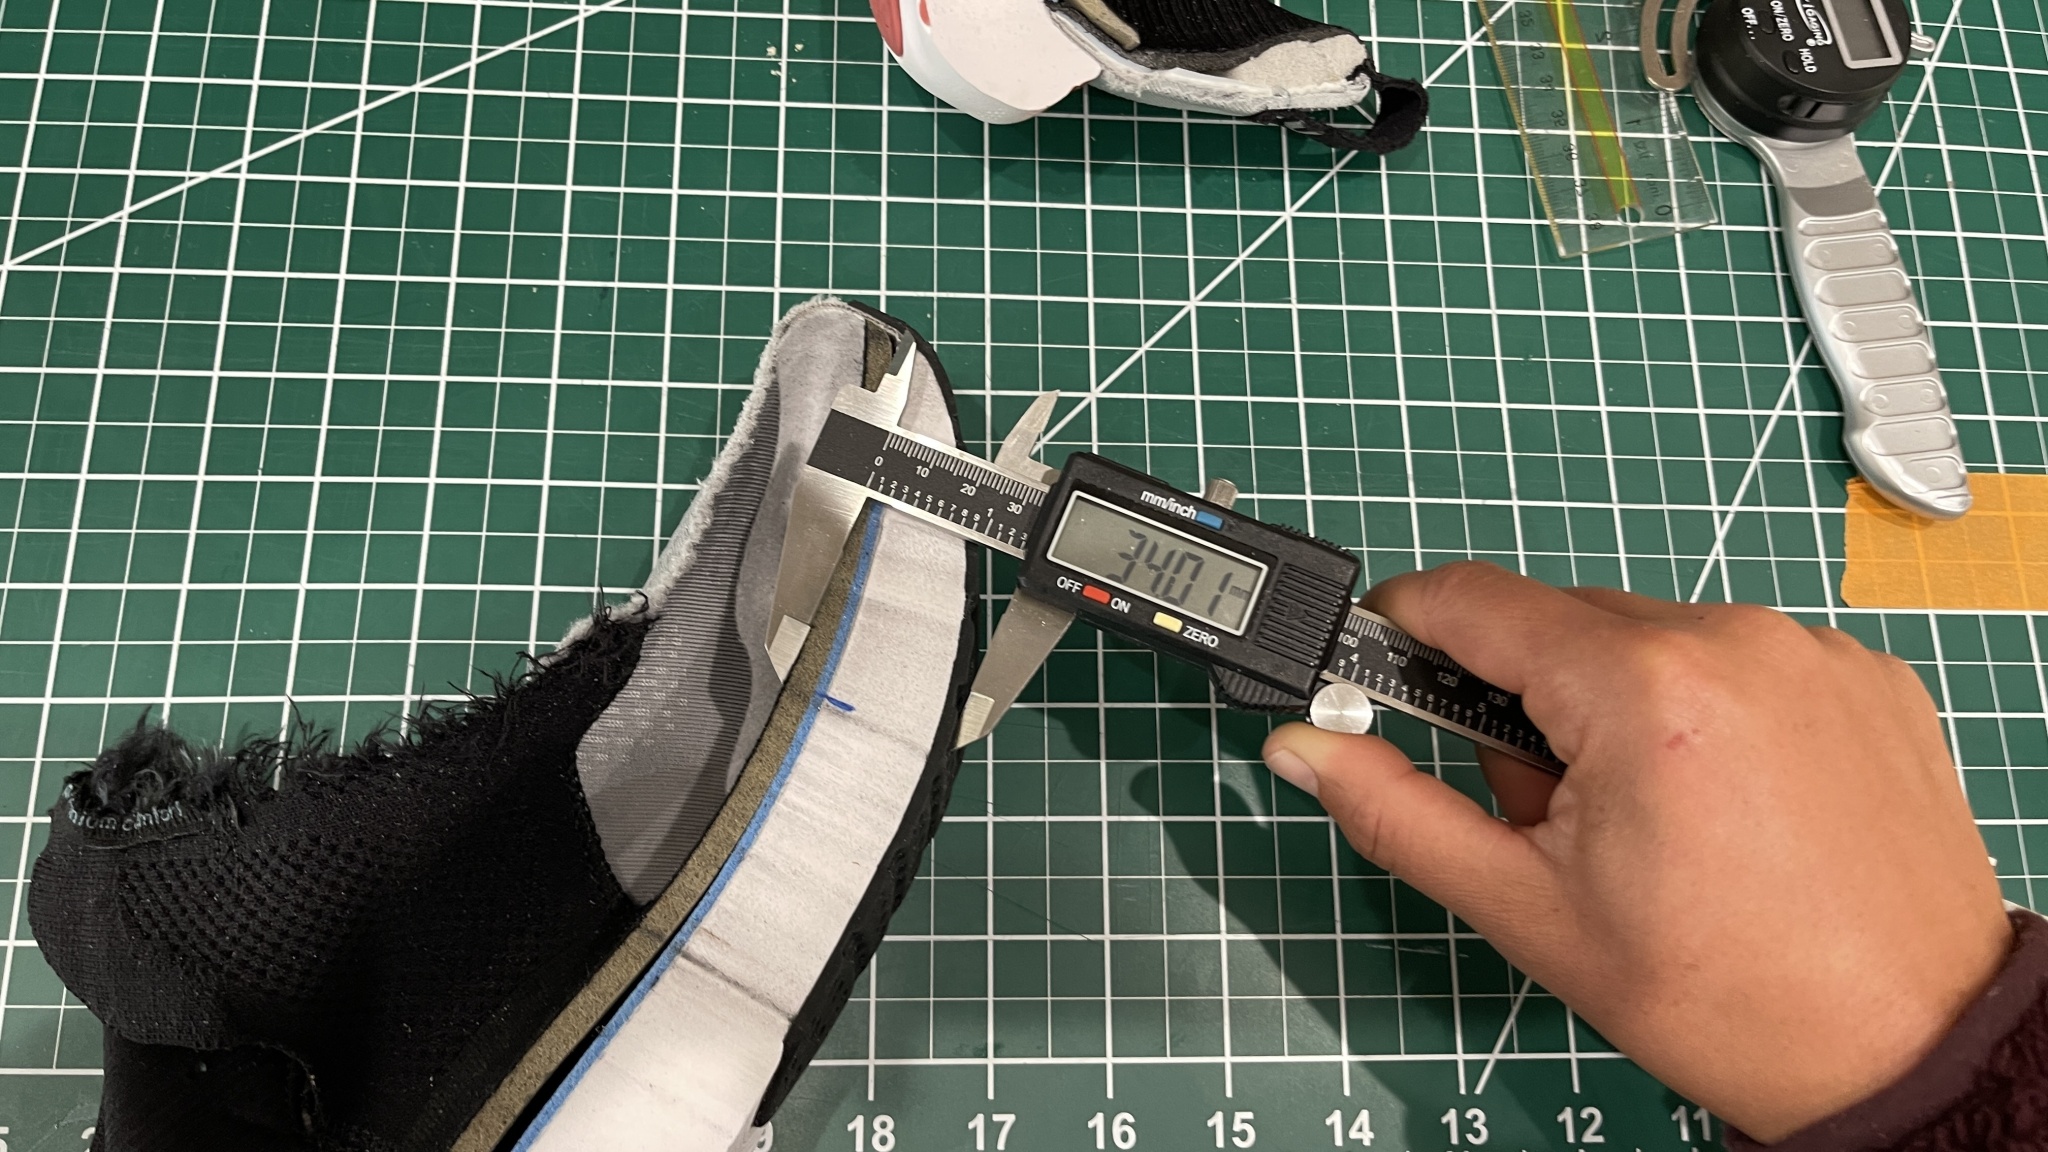
Weight
All weight comparisons were completed during our in-house testing. We weighed each shoe right out of the box on the same scale.
